Welcome to F# Weekly,
A roundup of F# content from this past week:
News
- Welcome new features for Xamarin F# addin (Refactor ->Rename and more)!
- New up-for-grabs issues in FSharp.Formatting. (For those who want to learn some F# & contribute to a nice tool :-))
- Ryan Riley presented “F#nctional Times“.
- IPython notebook F# profile intellisence is better now than what’s in IPython standard.
- “Calculating Cumulative Binomial Distributions” and “Asynchronous and Agent-based Programming” are new chapters to F# Deep Dives.
- Richard Minerich presented F# template for Vindinium.
- New documentation for “F# Formatting: Command line tool” is available.
- Using F# Units of Measure in a temperature converter on .NET Fiddle.
- SQLProvider 0.0.5-alpha is out on NuGet with MySQL and Oracle support.
- Srdjan Strbanovic shared collection of resources about Functional Programming.
- BlueMountain Capital Management COO is recognized as 14 in the Institutional Investor Trading Tech Top 40, and Deedle gets a mention. Congratulations!
- New screenshot: Integrated API docs in upcoming CloudSharper and Technical documentation in CloudSharper.
- Fredis (a BookSleeve wrapper for convenient usage from F#) was presented.
- Canopy 0.9.3 is now available with a few fixes and features!
- Battleship type provider was announced.
- Ideas for new type providers:
Video/Presentations
- “F# in action: playing functional Conway’s game of life” by Vagif Abilov.
- “New libraries for Client Side development in F#” by Reed Copsey.
- “F# for Fun and Games” with Anthony Brown.
-
“Information-Rich Programming in F# with Semantic Data” by Steffen Staab.
Blogs
- Yan Cui blogged “Introducing, DSLs to query against Amazon CloudWatch metrics“.
- Craig Stuntz wrote “Let’s Build a Compiler… In F#!“.
- Christian Horsdal posted “In Search of Maybe in C#“.
- Jack Fox blogged “Combining FsCheck Properties in a single Test“.
- Joe Mayo wrote “Using LINQ to Twitter with F#“.
- Anthony Brown posted “Solving interview problems in F#“.
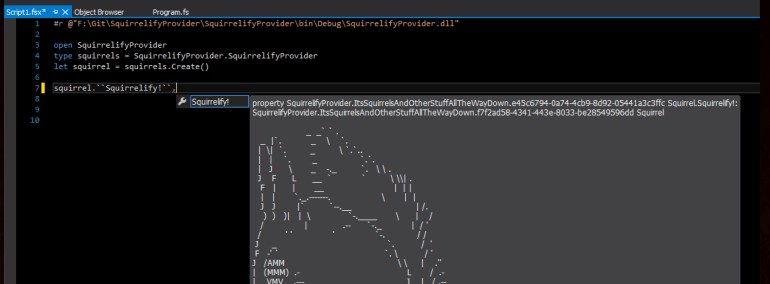
- Ross McKinlay presented “The amazing Squirrelify type provider“.(The world’s first ever use of an infinite (ie. unbounded) number of nominal type definitions.)
- Nice blog on modelling electric circuits in F# programming, using units-of-measure.
- Yan Cui updated “Performance benchmarks updated” (+Jil JSON serializer).
- Cameron Taggart posted “Source Link to CodePlex“.
- Jamie Dixon wrote about “Basic Insert Operation Using F#“.
- Ross McKinlay presented “The MineSweeper Type Provider“.
- Steffen Forkmann blogged “FAKE 2.8 released – DotCover and TestFlight support“.
- Jorge Tavares posted “F# Impressions“.
FsAdventJP
- Computation Expressions.
- The ‘yield’ and ‘return’ in computation expressions.
- Formatting customization for printf “%A”.
- F# Syntax on Sublime Text.
That’s all for now. Have a great week.
Previous F# Weekly edition – #4
![]()