 Neural networks are very powerful tool and at the same time, it is not easy to use all its power. Now we are one step closer to it from F# and .NET. We will delegate model training to R using R Provider. Also we will use Deedle (that was announced some days ago) for handy data manipulation.
Prerequisites:
Learning from Data:
First of all, we need to load required assemblies into our FSI session. It is pretty easy with FsLab because package have bootstrapping script.
#load "..\packages\FsLab.0.1.4\FsLab.fsx"
The next step is to download and install missed R packages. For this demo, we need neuralnet for training neural network model and prediction, caret for data visualization.
open RProvider.utils
R.install_packages("MASS")
R.install_packages("pbkrtest")
R.install_packages("lattice")
R.install_packages("Matrix")
R.install_packages("mgcv")
R.install_packages("grid")
R.install_packages("neuralnet")
R.install_packages("caret")
R.install_packages("zoo")
Now we are ready to start work. We need to open namespaces and load a data set. For this demo, we have chosen iris data set, which is classic for lots of demos.
open Deedle
open RDotNet
open RProvider
open RProvider.``base``
open RProvider.datasets
open RProvider.neuralnet
open RProvider.caret

let iris : Frame<int, string> = R.iris.GetValue()
To better understand what we are going to do, let’s plot this data set. First of all, split data into two parts: features (Sepal.Length; Sepal.Width; Petal.Length; Petal.Width) and a target variable (Species). After that plot these data into different dimensions (different colors represent different Species).
let features =
iris
|> Frame.filterCols (fun c _ -> c <> "Species")
|> Frame.mapColValues (fun c -> c.As<double>())
let targets =
R.as_factor(iris.Columns.["Species"])

R.featurePlot(x = features, y = targets, plot = "pairs")
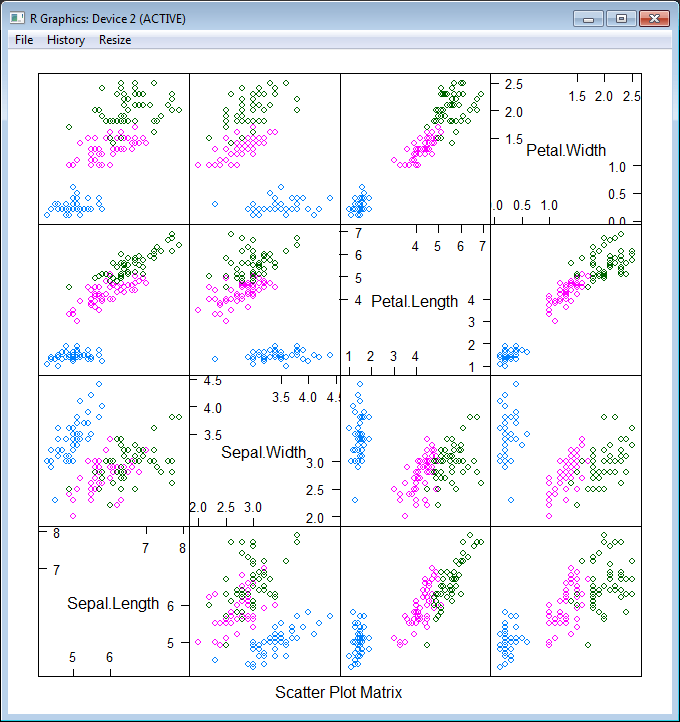
As you see, our task is not trivial – we have 3 classes instead of 2 (that is not classic situation) and classes are not clearly separable. Nevertheless let’s try! First of all, we need to split our data into 2 parts – training and testing data sets (70% vs 30%). The first part will be sent to the neural network for learning, the second one will be used for measuring model quality. Also let’s shuffle data to be honest.
iris.ReplaceColumn("Species", targets.AsNumeric())
let range = [1..iris.RowCount]
let trainingIdxs : int[] = R.sample(range, iris.RowCount*7/10).GetValue()
let testingIdxs : int[] = R.setdiff(range, trainingIdxs).GetValue()
let trainingSet = iris.Rows.[trainingIdxs]
let testingSet = iris.Rows.[testingIdxs]
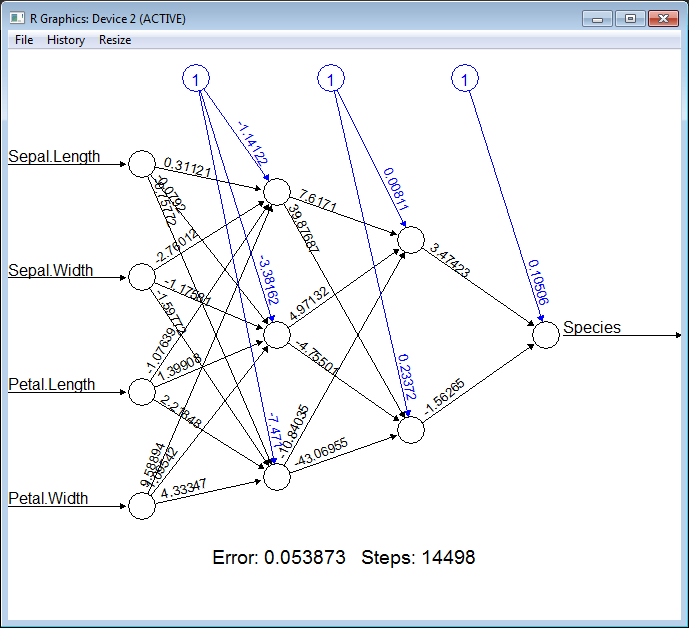
Now we are ready to train a neural network, all we need is to provide a formula (specify what is the input for our model and what is the output) “Species ~ Sepal.Length + Sepal.Width + Petal.Length + Petal.Width”, provide a data set and specify the structure of hidden layers. In the following example, we will train the network with two layers of hidden nodes, the first layer with 3 nodes and the second layer with 2 nodes.
let nn =
R.neuralnet(
"Species ~ Sepal.Length + Sepal.Width + Petal.Length + Petal.Width",
data = trainingSet, hidden = R.c(3,2),
err_fct = "ce", linear_output = true)

// Plot the resulting neural network with coefficients
R.eval(R.parse(text="library(grid)"))
R.plot_nn nn
Cool! How simple it is. To be able to measure quality of the classification we need to split our training set into features and targets.
let testingFeatures =
testingSet
|> Frame.filterCols (fun c _ -> c <> "Species")
|> Frame.mapColValues (fun c -> c.As<double>())
let testingTargets =
testingSet.Columns.["Species"].As<int>().Values
To execute the neural network on the new data (apply our classification) we should call R.compute method and pass the training data set there.
let prediction =
R.compute(nn, testingFeatures)
.AsList().["net.result"].AsVector()
|> Seq.cast<double>
|> Seq.map (round >> int))
Finally, let’s compare prediction results with testing values:
let misclassified =
Seq.zip prediction testingTargets
|> Seq.filter (fun (a,b) -> a<>b)
|> Seq.length

printfn "Misclassified irises '%d' of '%d'" misclassified (testingSet.RowCount)
If you execute all these steps one by one, you will see that there are only ~3 misclassifies of 45 samples. Pretty well quality.
Full script:
#load "..\packages\FsLab.0.1.4\FsLab.fsx"

// You need to install 'nnet' and 'caret' packages if you do not have them
open RProvider.utils
open RProvider.utils
R.install_packages("MASS")
R.install_packages("pbkrtest")
R.install_packages("lattice")
R.install_packages("Matrix")
R.install_packages("mgcv")
R.install_packages("grid")
R.install_packages("neuralnet")
R.install_packages("caret")
R.install_packages("zoo")

open Deedle
open RDotNet
open RProvider
open RProvider.``base``
open RProvider.datasets
open RProvider.neuralnet
open RProvider.caret

// Load data from R to Deedle frame
let iris : Frame<int, string> = R.iris.GetValue()

// Observe iris data set
let features =
iris
|> Frame.filterCols (fun c _ -> c <> "Species")
|> Frame.mapColValues (fun c -> c.As<double>())
let targets =
R.as_factor(iris.Columns.["Species"])

R.featurePlot(x = features, y = targets, plot = "pairs")

iris.ReplaceColumn("Species", targets.AsNumeric())
// Split data to training and testing sets (70% vs 30%)
let range = [1..iris.RowCount]
let trainingIdxs : int[] = R.sample(range, iris.RowCount*7/10).GetValue()
let testingIdxs : int[] = R.setdiff(range, trainingIdxs).GetValue()
let trainingSet = iris.Rows.[trainingIdxs]
let testingSet = iris.Rows.[testingIdxs]

// Train neural network
let nn =
R.neuralnet(
"Species ~ Sepal.Length + Sepal.Width + Petal.Length + Petal.Width",
data = trainingSet, hidden = R.c(3,2),
err_fct = "ce", linear_output = true)

// Plot the resulting neural network with coefficients
R.eval(R.parse(text="library(grid)"))
R.plot_nn nn

// Split testing set into features and targets
let testingFeatures =
testingSet
|> Frame.filterCols (fun c _ -> c <> "Species")
|> Frame.mapColValues (fun c -> c.As<double>())
let testingTargets =
testingSet.Columns.["Species"].As<int>().Values

// Predict `Species` for testingFeatures with neural network
let prediction =
R.compute(nn, testingFeatures)
.AsList().["net.result"].AsVector()
|> Seq.cast<double>
|> Seq.map (round >> int))

// Calculate number of misclassified irises
let misclassified =
Seq.zip prediction testingTargets
|> Seq.filter (fun (a,b) -> a<>b)
|> Seq.length

printfn "Misclassified irises '%d' of '%d'" misclassified (testingSet.RowCount)
P.S.
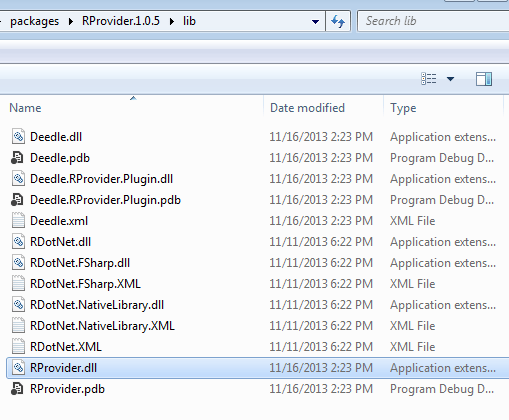
Notice, if you have problems with bootstrapping RProvider and/or converting R data frame to Deedle data frames – you need to verify that during installation of NuGet packages, all assemblies have been copied to RProvider’s lib sub-folder (see in the following picture).