There are some cases when you host and/or maintain 3rd-party .NET products in IIS and logs are not enough to understand the importance of some issues and find root causes. You may need the high-level view of what’s actually going on live.
Fortunately, Microsoft has a tool called Application Insights Status Monitor that can help you to instrument your IIS site with required configs to start collecting telemetry data into Application Insights.
There are blog posts like “Configure an IIS Server To Use Application Insight” that already provide step by step guide on how to use the tool.
In this post, I want to go one step further and share some tips on how to use it for Microsoft products. So here you can find extra steps which you may need during setup on Office Online Server, but I guess that you can do the same with on-premise SharePoint farm as well.
Configure Telemetry for Office Online Server
- Create a new instance of Application Insights
- Install Application Insight Status Monitor on machines with Office Online Server. You can do it using the direct link http://go.microsoft.com/fwlink/?LinkID=506648 that will run installation using Web Platform Installer.
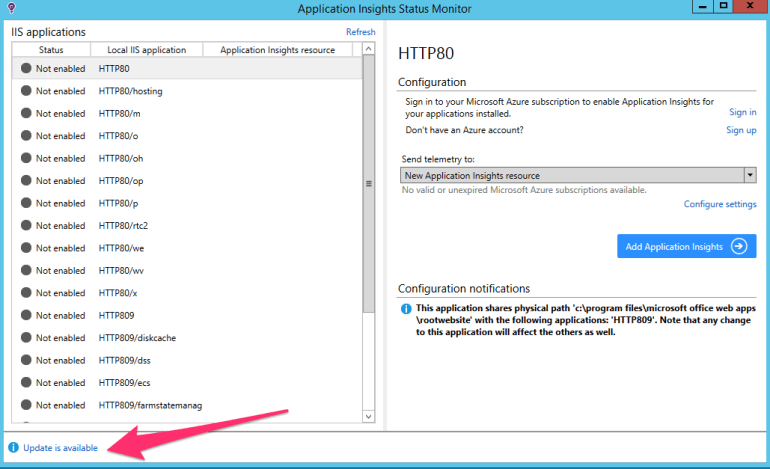
- Download update (the latest SDK version from NuGet). Click “Update is available” and then “Install Update”.
You may see an error message that app cannot download new SDK from NuGet
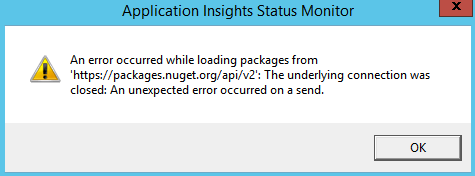
This can mean that IE Enhanced Security Configuration is enabled on your server, in this case, you need to temporarily turn it off:- Open Server Manager
- Go to Local Server, find “IE Enhanced Security Configuration” and turn it off.
Do not forget to turn it on again when you finish this guide!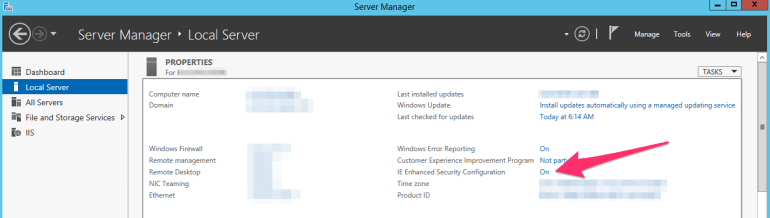
- Sign in using your Azure account
- Your sign in flow may end with error “Authentication failed: service_returned_error: Service returned error. Check InnerException for more details”
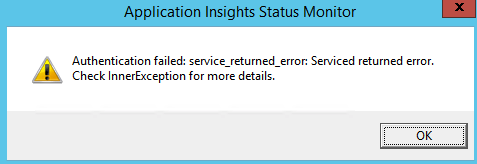
- Go to Event Viewer\Windows Logs\System. If you see Errors from Schannel with a message like “A fatal error occurred while creating an SSL client credential. The internal error state is 10013.” then it is System-wide crypto issue and you need to allow “Use FIPS compliant algorithms for encryption, hashing, and signing” and try to sign in again.
- Your sign in flow may end with error “Authentication failed: service_returned_error: Service returned error. Check InnerException for more details”
- Configure each IIS application to send telemetry to Application Insights resource created in step 1.
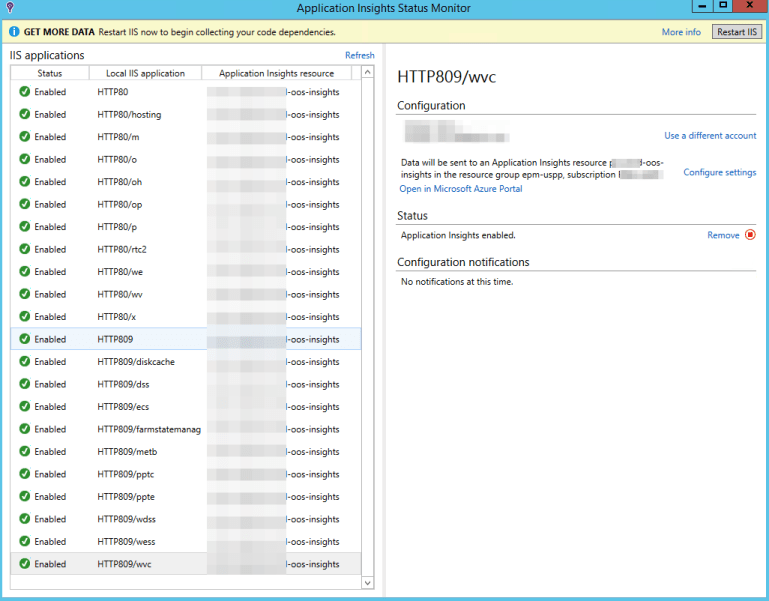
- Restart IIS from the Status Monitor app to start collecting telemetry data.
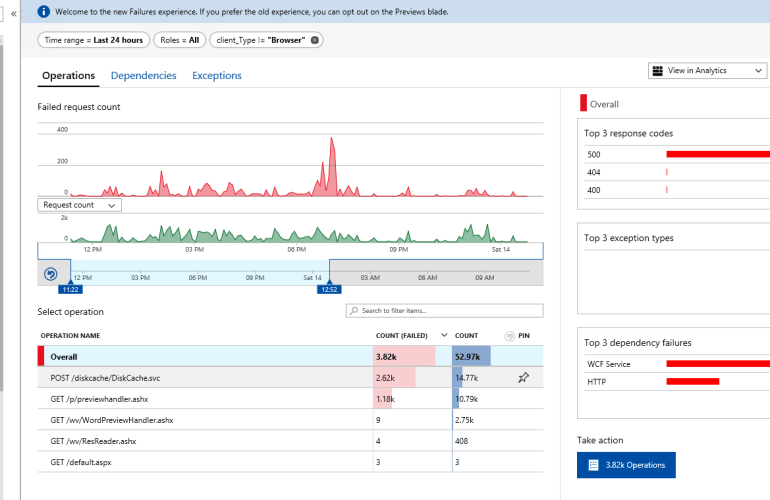
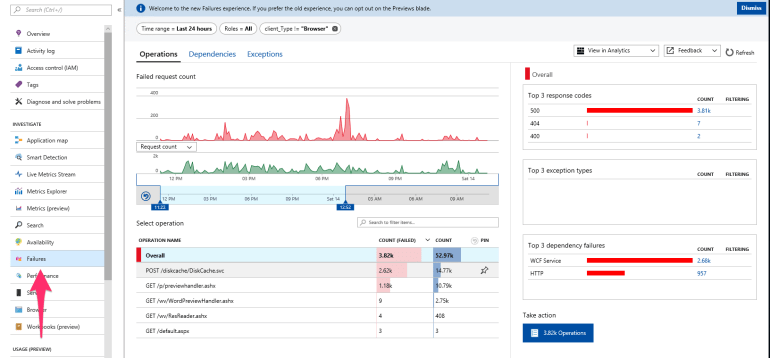
- Wait for some time to collect enough data to analyze (for example one day).
- After that, you can start digging deeper into collected stats to better understand what’s actually going on.
- Turn on IE Enhanced Security Configuration.
Performance Counters Note: Actually Application Insights Status Monitor does two simple things: updates web.config to incorporate Application Insights and puts ApplicationInsights.config beside with configuration. By default, it is configured to collect data from performance counters, but it may not work if your Application Pool is running under an account that does not have permissions to access performance counters. Note, that in this case, you have to add App Pool account to Performance Monitor Users group. Read more.
Discover more from Sergey Tihon's Blog
Subscribe to get the latest posts sent to your email.
